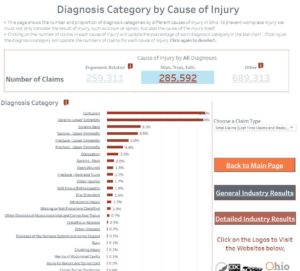
The CDC’s National Institute for Occupational Safety and Health and our own state’s Ohio Bureau of Worker’s Compensation joined forces to develop some really cool interactive charts. They show worker injury trends in Ohio over a 10-year span. It’s no surprise that the Diagnosis by Cause chart has Slips, Trips, and Falls in a category all by itself. Click on the Number of Claims (285,592!) to see the resulting diagnoses.
Share this post:
Facebook
Twitter
LinkedIn
Email
Subscribe to blog updates
Featured
30 Years of ADA – Ramping Up Accessibility
Prevent Slip & Fall
Recent posts


